
AI, cloud and data · Dashboards and MIS
Know your numbers every morning.
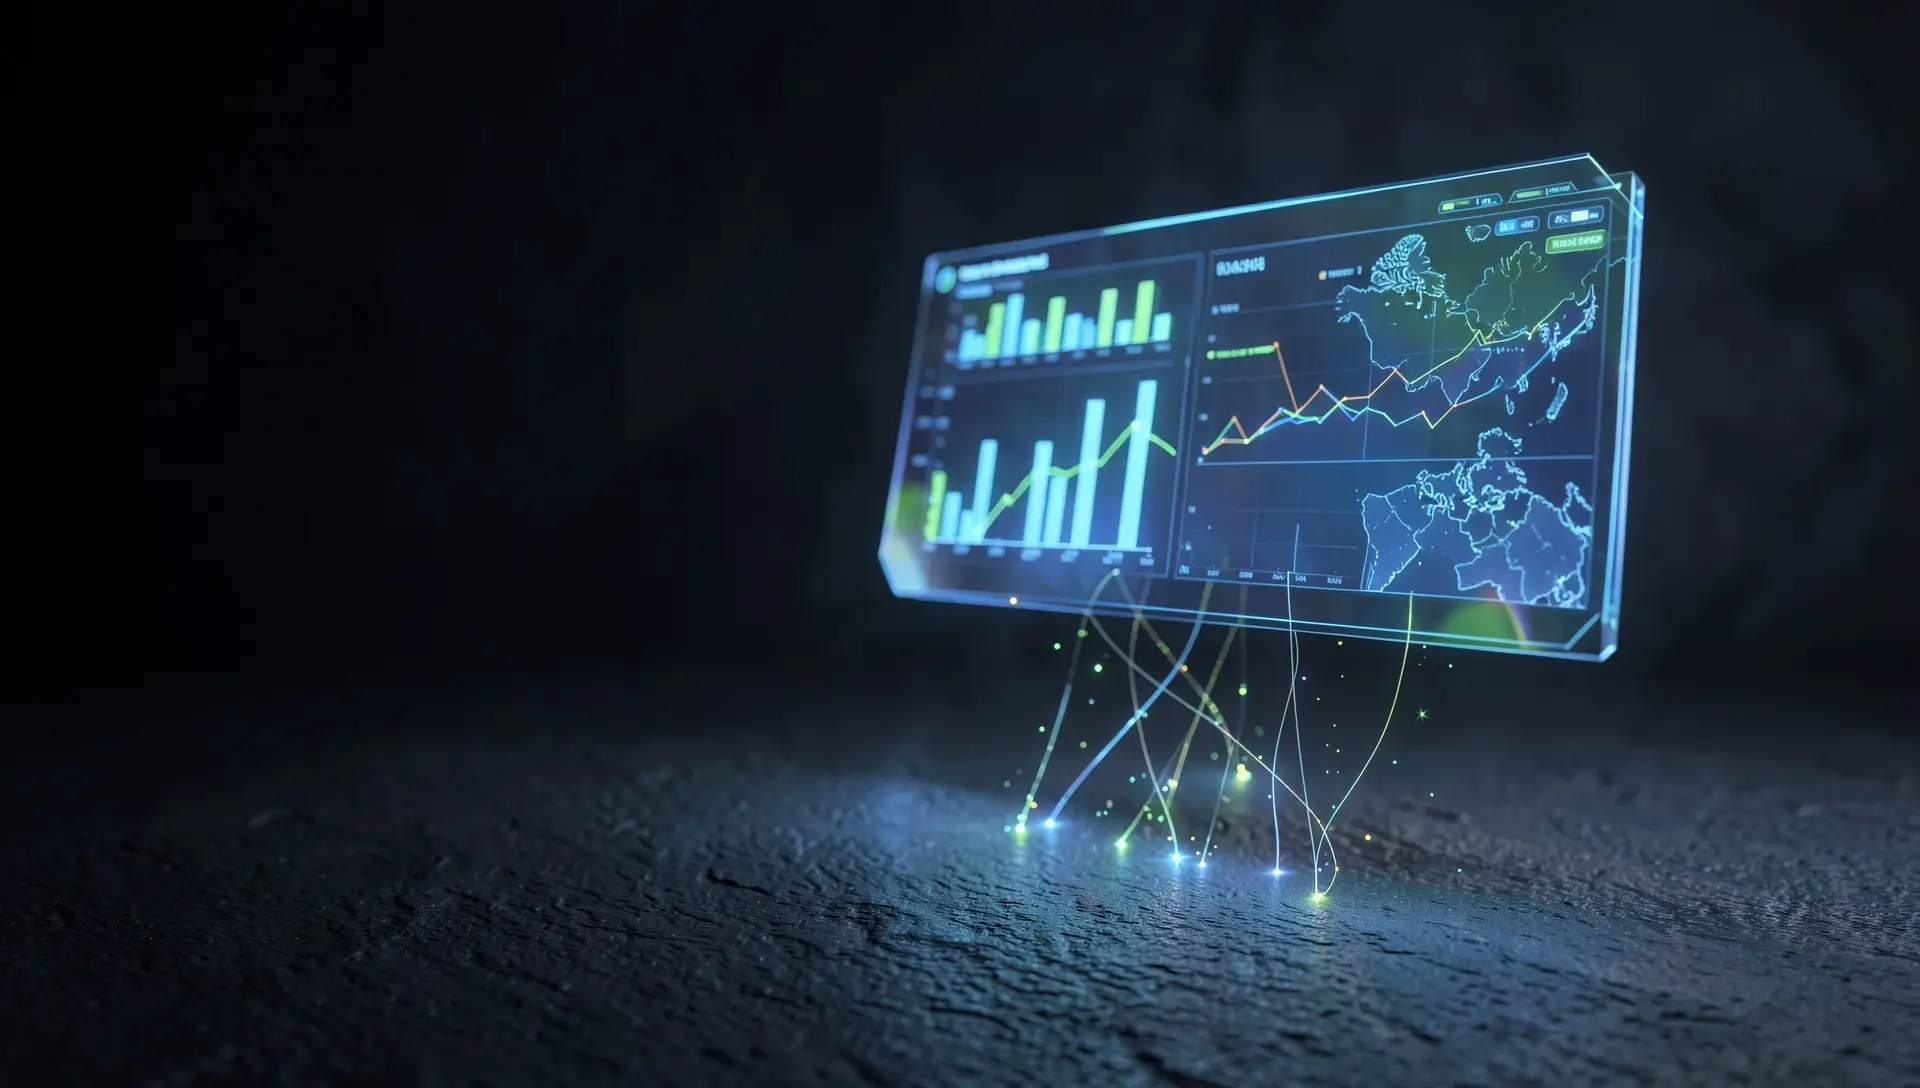
Your operations, finance, field or programme data on one live screen, so leaders decide on facts, not last month’s spreadsheet.
- Connects to the data you already have
- Each person sees only their data
- A morning summary by email or message
What it is
What is dashboards & MIS?
One screen that shows what is happening on the ground today, not in last month's Excel.
Operations, finance and field data on one live screen. No more waiting for the monthly report.
Why projects fail
Where it usually goes wrong, and how we prevent it.
Where it goes wrong
- Reports are put together by hand from district or branch Excel sheets.
- The numbers change depending on who you ask.
- You learn about delays when it's too late to act.
- Senior officers want one view, on their phone.
How Loopnexa builds it
- Agree the decisions that matter. The handful of numbers your leaders check every day. We start there, not with fifty charts.
- Connect the data you already have. Accounting software, spreadsheets, your existing systems, or a simple data-entry app.
- One clear screen per role. Big numbers, simple charts and alerts when something needs attention, on phone and desktop.
- Let the numbers come to you. A short summary by email or message every morning, so nobody has to log in to stay informed.
What we offer
Dashboards & MIS, end to end.
- MIS designWe define the indicators and formats, and who enters what, with your team.
- Live dashboardsKPIs, trends and drill-down from state to block, or from company to branch.
- Maps & geo-taggingProjects, visits and assets on a map, with photo evidence.→
- Data pipelinesData pulled from your apps, Excel uploads, Google Sheets and existing databases.
- Power BI or open-source BIPower BI if you already have licences; Superset or Metabase if you don't.
- Scheduled reportsPDF and Excel reports in Hindi and English, by email or WhatsApp.
Questions
What people ask about dashboards and MIS.
Power BI or a custom dashboard?
Power BI is quick to build if your staff already have Microsoft licences and your data is tidy. A custom dashboard costs more to build, but has no per-user fees, works for hundreds of field users, and can include the data-entry forms. We recommend one in the scope.
Our data is in Excel and on paper. Can you still help?
Yes. That's the usual starting point. We begin with Excel uploads in fixed formats, then replace them with a simple form or app so the data arrives clean.
Can officers see it on their phones?
Yes. Every dashboard works on a phone, and a summary can go out by WhatsApp or email each morning.
Where is the data stored?
On servers in India: your NIC or State Data Centre, or AWS or Azure India regions, which are MeitY-empanelled. Access is role-based and every change is logged.
How long does it take?
A first dashboard on existing data takes 3–4 weeks. A full MIS with data collection takes 2–4 months.
Can it show data by district, block and panchayat?
Yes. We use LGD codes so your figures line up with other government systems, and every level can drill down.
Related services
Often paired with dashboards and MIS.


Ready to start with dashboards and MIS?
- Talk to usBook a 30-minute call with a director↗
- Emailadmin@loopnexa.net↗
- WhatsAppHindi or English, whichever you prefer↗
How every project runs, from the first week to support: our method